Best Greyhound Betting Sites – Bet on Greyhounds in 2026
- Anatomy of a Monmore Racecard: Every Field Mapped
- Form Figures Decoded: What 1-2-3-4-5-6 Actually Means
- Trap Numbers and Jacket Colours: Your Quick Reference
- Times, Sectionals and Calculated Distances
- Trainer, Weight and Comment Lines: Hidden Information
- From Racecard to Selection: A Step-by-Step Example
- Five Mistakes New Racecard Readers Make at Monmore
A Monmore racecard looks like a wall of numbers until you know where to look. Six rows of compressed data — one for each dog in the race — packed with finishing positions, times, trap draws, weights, trainer names, and cryptic comment lines that might as well be written in code. For a first-timer, the natural response is to skip all of it and back the dog with the shortest price. For anyone who wants to bet with a genuine edge, the racecard is the single most important document in the building.
Reading a Monmore racecard is not difficult. It is methodical. Each field on the card serves a specific purpose, and once you understand what each one tells you — and, just as importantly, what it does not tell you — the wall of numbers transforms into a readable story about every runner’s recent history, physical condition, and likely behaviour in tonight’s race. The form figures reveal consistency and trajectory. The times reveal speed and running style. The trap draw reveals starting position and the geometric advantage or disadvantage it carries at this particular track.
This guide maps every field on a standard Monmore racecard, explains what the numbers mean in practical terms, and walks through a complete selection process from card to bet. It is written for the person who has looked at a racecard and felt overwhelmed, but it does not assume you are unintelligent — just unfamiliar. By the end, you will be able to read a Monmore racecard with the same confidence as a regular at the track. What you do with that information is up to you.
Anatomy of a Monmore Racecard: Every Field Mapped
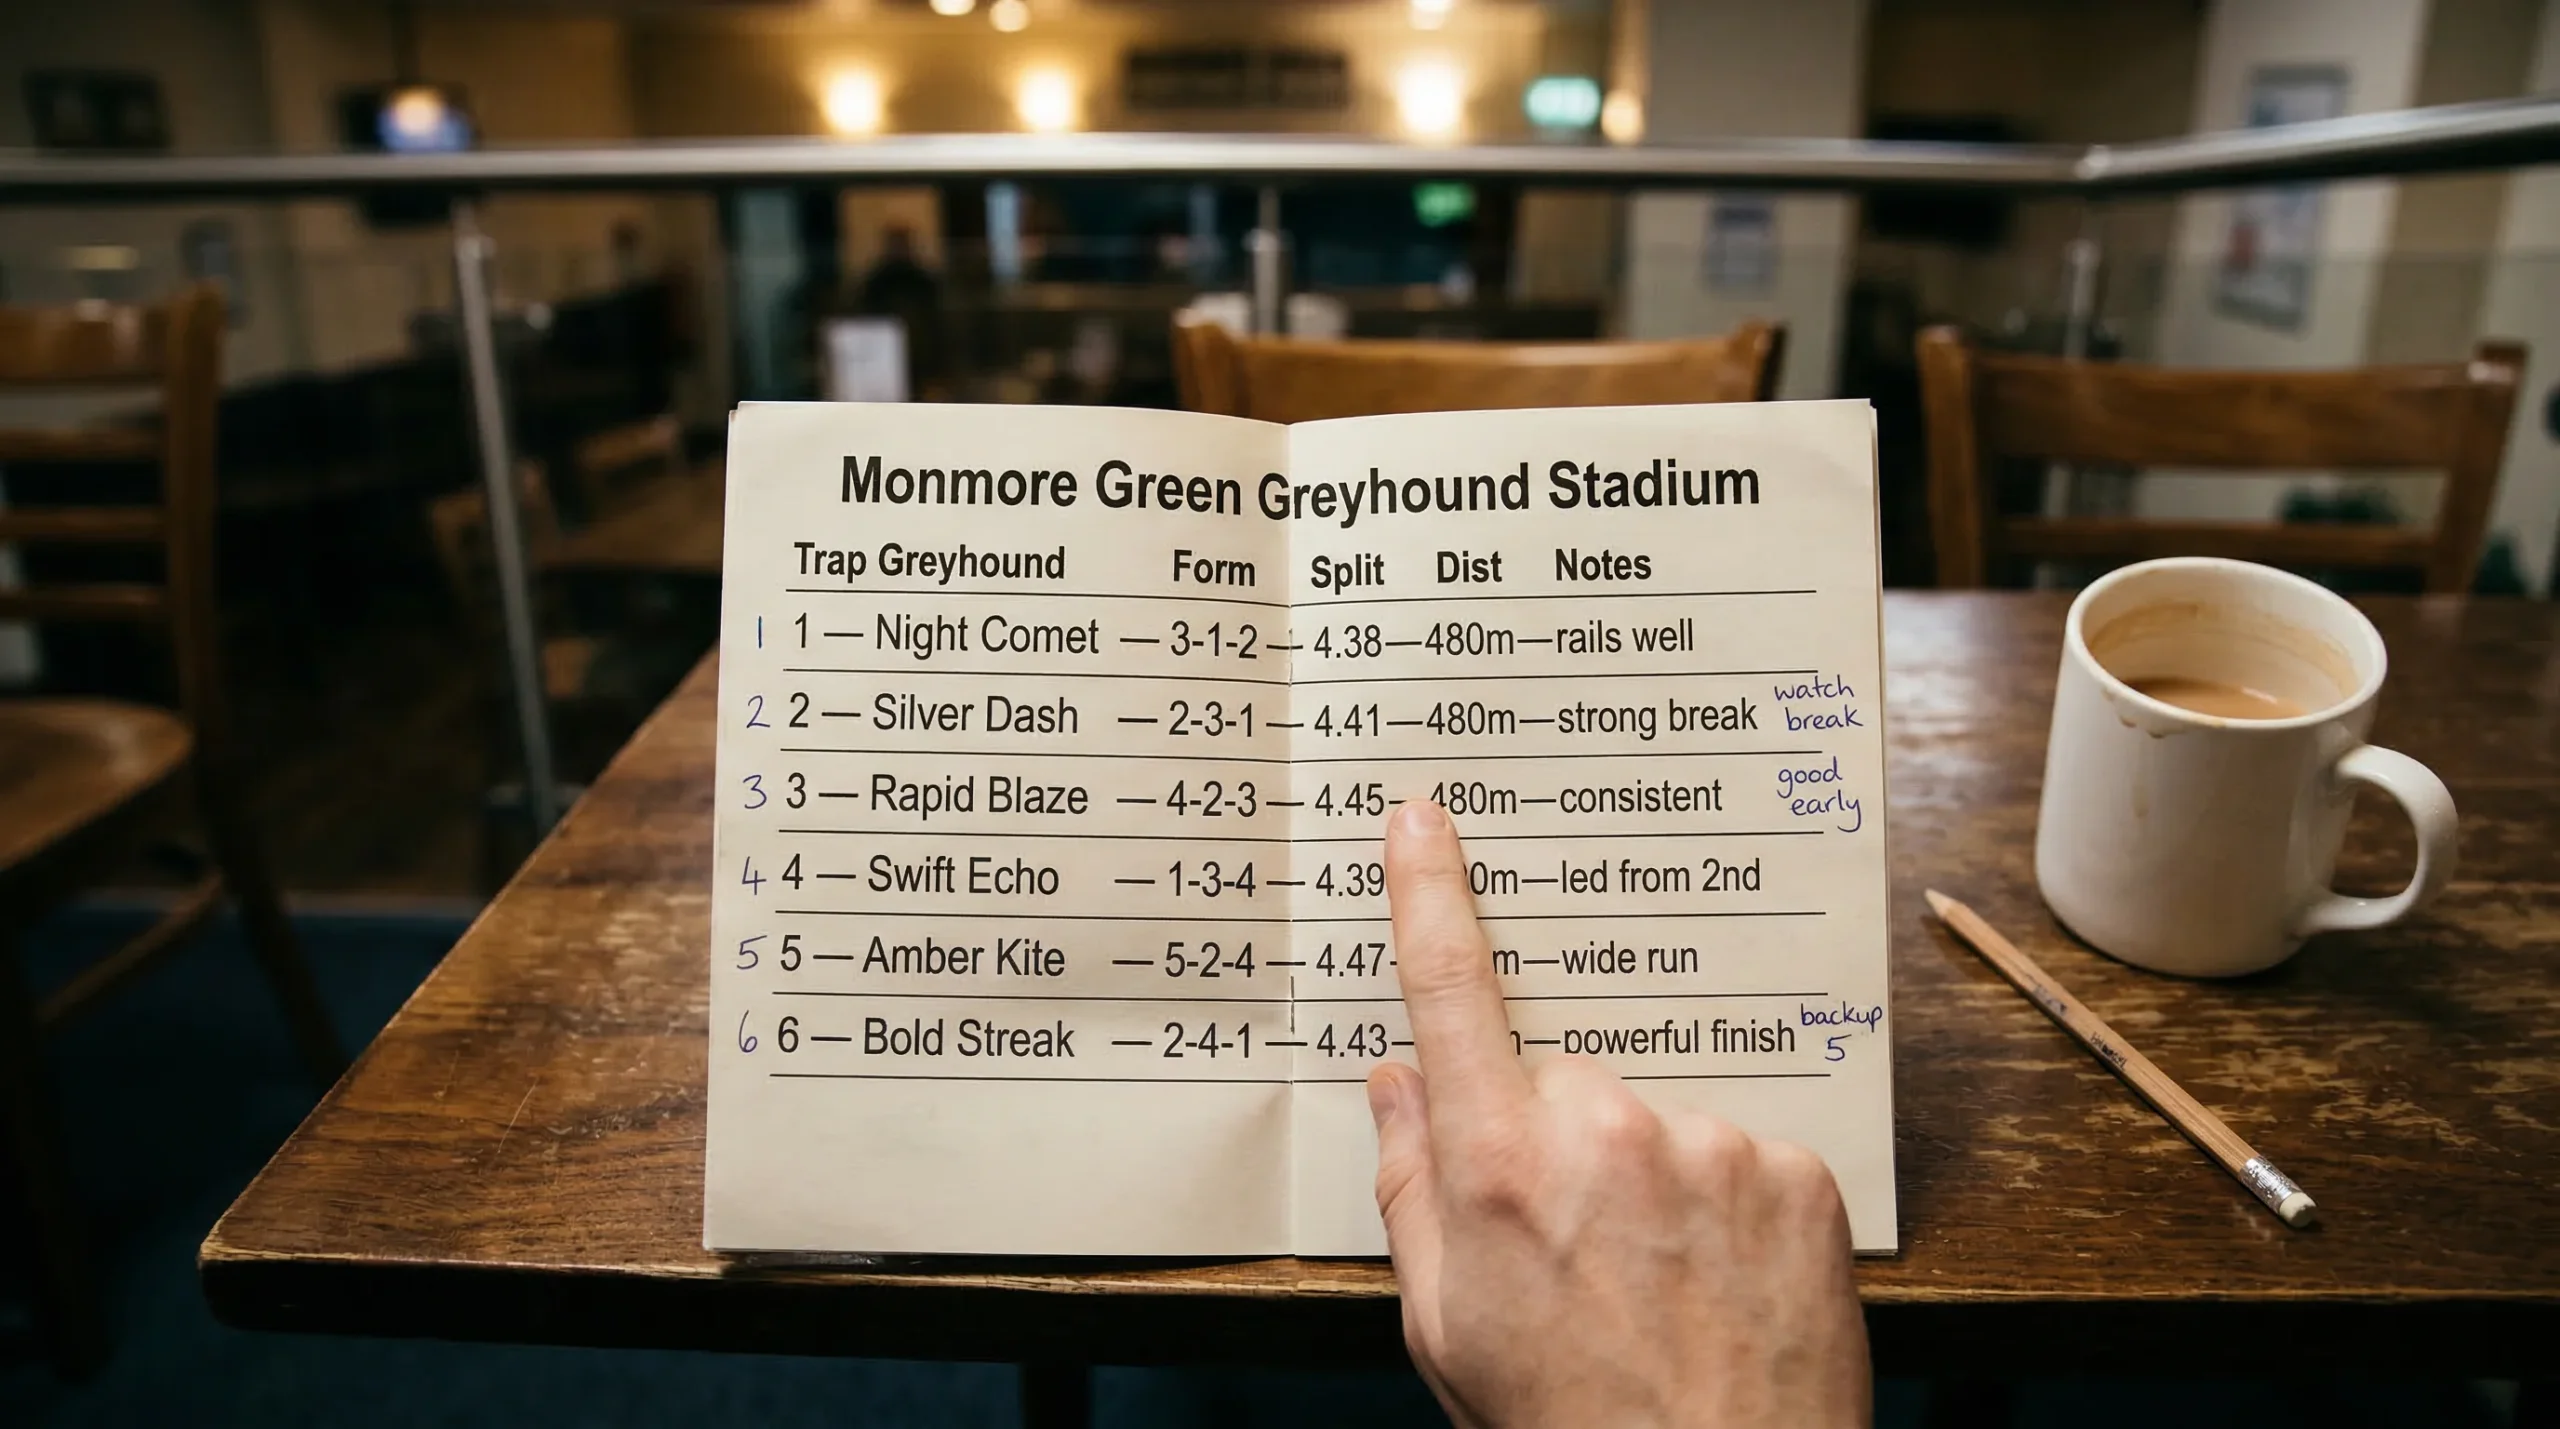
A Monmore racecard is laid out in rows — one per runner — with columns for each piece of data. The exact format varies slightly depending on whether you are reading a printed programme at the track, a bookmaker’s online card, or a specialist form site, but the core information is the same. Here is what you will find, roughly in the order it appears.
The trap number and jacket colour come first. Trap 1 is always red, Trap 2 blue, Trap 3 white, Trap 4 black, Trap 5 orange, and Trap 6 striped black-and-white. This is universal across UK greyhound racing and tells you the dog’s starting position. At Monmore, which races over five distances — 264, 480, 630, 684, and 835 metres — the trap number is more than cosmetic. The distance of tonight’s race determines how many bends the field will negotiate, and that determines how much the inside-outside draw matters. A 264-metre sprint has two bends; an 835-metre marathon has eight. The trap draw carries different weight at each distance, and the racecard gives you the starting point for that assessment.
Next comes the dog’s name, usually in bold. Beside it, or below it, you will see the trainer’s name. On some racecards, the owner is listed too, though for betting purposes the trainer is the more useful piece of information. Monmore has a core group of trainers who supply runners regularly, and over time you develop a sense of which kennels produce dogs that perform well at this track.
The form figures follow — a string of numbers representing finishing positions in the dog’s most recent races. These are the heart of the racecard, and they deserve their own section, which follows below. For now, note that the form line is read left to right, with the oldest run on the left and the most recent on the right. Letters may appear in the string too: “F” for fell, “T” for trapped at the start, “B” for bumped, and so on. Each letter is shorthand for an incident that affected the dog’s run.
The time column shows the dog’s finishing time at its most recent Monmore run, or at a comparable track and distance. At Monmore, times are recorded to two decimal places. A 480-metre race time in the mid-29 seconds is competitive in higher grades; low-30 seconds is more typical of middle-graded runners. The time alone does not tell you everything — it was set on a particular night, in particular conditions, from a particular trap — but it gives you a baseline for comparing dogs within the same race.
Sectional times, where available, break the overall time into segments. The most common split is the time to the first bend, which at Monmore is measured at 103 metres. This figure is crucial for assessing early pace. A dog that consistently reaches the first bend in fast splits is a front-runner — likely to lead from the traps and benefit from an inside draw. A dog with slower first-bend splits but a strong overall time is a closer, making up ground in the second half of the race.
Weight is recorded in kilograms to one decimal place. The racecard shows the dog’s weight at its most recent race and sometimes a trend arrow indicating whether it has gained, lost, or maintained weight. Finally, the comment line — a brief coded note from the race official summarising how the dog ran. Terms like “led throughout,” “crowded first bend,” or “challenged wide” give you a narrative snapshot that the numbers alone do not capture. The comment line is where you find the stories behind the statistics.
Form Figures Decoded: What 1-2-3-4-5-6 Actually Means
The form line is the single most-glanced and least-understood element on a Monmore racecard. A string like “2-1-1-3-1” looks straightforward — the dog has won three of its last five races and placed in the other two. Strong form. Back it and move on. But that reading misses almost everything that matters.
Each number in the form string refers to a finishing position in a specific race, at a specific track, over a specific distance, in a specific grade. A “1” at Monmore over 480 metres in Grade A3 is a very different proposition to a “1” at Sunderland over 285 metres in Grade A8. The former means the dog beat five competitive rivals over a standard four-bend trip at a well-graded track. The latter means it won a two-bend sprint against weaker opposition at a smaller venue. If the racecard does not specify the track and distance for each run — and many abbreviated cards do not — you need to check the full form elsewhere before drawing conclusions.
The grade is particularly important. Monmore uses an A1-to-A10 grading system, with A1 being the highest standard of graded racing and A10 the lowest. A dog that has been winning in A8 and is stepping up to A5 tonight is facing a significant jump in class. Its recent form figures may look impressive — 1-1-2-1 — but those wins came against slower dogs. Conversely, a dog dropping from A3 to A5 might show a form line of 4-5-3-6, which looks poor until you realise it was competing two grades above tonight’s level. Form figures without grade context are numbers without meaning.
Letters in the form string carry important information. “F” means the dog fell during the race — a traumatic event that can affect subsequent runs through loss of confidence or lingering injury. “T” indicates the dog was trapped — stuck in the starting box or slow to exit, which can indicate a handling issue or a dog that does not break cleanly. “B” or similar codes indicate bumping or interference, which means the finishing position may not reflect the dog’s true ability. When you see letters in a form string, dig deeper. Check the comment line from that race if available, because the letter alone does not tell you whether the incident was minor or race-ending.
The recency of form matters too. Greyhounds are athletes with relatively short racing careers, and their form can change quickly. A dog that was winning four weeks ago may have picked up a minor strain since. A dog that was struggling six weeks ago may have been regrouped by the trainer and be ready to run a career-best tonight. The most recent run — the rightmost number in the form string — carries the most weight, but a single run can be misleading. The ideal is to see a pattern across three to five recent races that tells a consistent story: improving, declining, or holding steady.
One final nuance: the trap from which each previous run was made. A dog that finished second from Trap 6 over 480 metres may have run a better race than a dog that won from Trap 1 over the same distance, because the Trap 6 runner covered more ground through the bends. If that same dog is drawn in Trap 2 tonight, the improved draw could be the difference between another second and a win. Reading form figures without considering the trap draw is like reading a map without looking at the terrain.
Trap Numbers and Jacket Colours: Your Quick Reference
The six jacket colours in UK greyhound racing are fixed by regulation and identical at every licensed track, Monmore included. Trap 1 wears red, Trap 2 blue, Trap 3 white, Trap 4 black, Trap 5 orange, and Trap 6 the distinctive black-and-white stripes. These colours exist for a practical reason: when six dogs are sprinting around a bend at 40 miles per hour, the colours help spectators, commentators, and camera operators distinguish one runner from another.
For punters reading a Monmore racecard, the trap number does double duty. It identifies the dog’s jacket, and it tells you where the dog starts. Starting position is not random — dogs are drawn into traps based on their running style and grading history, with the Racing Manager aiming to produce competitive races. But regardless of how the draw is decided, the physics of the oval track mean that some traps carry a structural advantage.
Across UK tracks, Trap 1 — the red jacket — wins approximately 18 to 19 percent of all races, comfortably above the theoretical 16.66 percent that equal distribution would produce. This figure, drawn from analysis by TheGameHunter, is an industry-wide average. At Monmore specifically, the inside-draw advantage is well documented and consistent with the broader UK pattern. When you see a dog listed in Trap 1 on the racecard, you are looking at a runner with a built-in geometric edge — particularly at shorter distances where the bends carry more weight relative to the straights.
The outer traps — 5 and 6 — face the opposite situation. These dogs need to cover more ground through the bends unless they possess the raw speed to lead the field into the first turn. On a Monmore racecard, a dog drawn in Trap 5 or 6 with fast early-pace figures is still a contender. A dog drawn wide with slow first-bend splits is fighting two battles at once: against the other dogs and against the track geometry. The jacket colour tells you who is who. The trap number tells you where they start. Together, they are the first filter in your racecard assessment.
Times, Sectionals and Calculated Distances
Finishing times on a Monmore racecard are recorded to two decimal places and measured from the moment the traps open to the moment the dog crosses the line. At 480 metres, a competitive time in the upper grades sits in the high 28-second to low 29-second range. At 264 metres, you are looking at times around 15 to 16 seconds. At 835 metres, the clock stretches past 53 seconds. These benchmarks are rough — they shift with track conditions, weather, and the quality of the field — but they give you a frame of reference for comparing dogs within the same race.
Raw finishing time is useful but limited. A dog that ran 29.20 from Trap 1 over 480 metres on a fast, dry night covered less ground than a dog that ran 29.40 from Trap 6 on the same card. The Trap 6 runner negotiated wider arcs through every bend, adding distance to its actual run. Calculated distance attempts to account for this by adjusting the raw time to reflect the estimated ground covered. Not all racecards display calculated distances, but specialist form services do. When available, calculated distance is a more accurate measure of a dog’s ability than raw time, because it levels the playing field between inside and outside draws.
Sectional times are the most revealing numbers on the card for anyone trying to understand how a dog runs its race. At Monmore, the primary sectional split is the time from boxes to the first bend at 103 metres. A dog that reaches the first bend in 6.6 seconds is showing explosive early pace. A dog that takes 7.0 seconds is either slower out of the traps, more measured in its running style, or both. The difference between 6.6 and 7.0 might seem trivial — less than half a second — but in a six-dog sprint to the first bend, that gap translates to multiple lengths.
The first-bend sectional is where trap draw and running style intersect. A dog with fast early splits drawn in Trap 1 is almost certainly going to lead into the first bend and hold the rail. That combination — early pace plus inside draw — is the single most powerful configuration on a Monmore racecard. A dog with fast splits drawn in Trap 6 will still reach the first bend quickly but will need to either cross the field to find the rail or accept that it is running wide. The sectional time tells you the dog has the speed. The trap draw tells you whether it has the position to use it.
The second-half split — from first bend to finish — reveals stamina and finishing kick. A dog with a fast first-bend time but a slow second half is a pure speed runner that fades in the closing stages. A dog with an average first-bend time but a strong overall finish is a closer. At 480 metres and beyond, closers can be profitable to follow because the market often overvalues early speed. The racecard gives you the data to identify both types. Your job is to match the running style to the distance, the draw, and the likely pace of the race.
Trainer, Weight and Comment Lines: Hidden Information
Most punters glance at the trainer name on a Monmore racecard and move on. That is a missed opportunity. UK greyhound racing sustains approximately 500 licensed trainers and around 3,000 kennel staff, according to GBGB data. Behind that number is a competitive profession where kennel management, fitness preparation, and track knowledge separate the top operations from the rest.
At Monmore, a handful of trainers supply the majority of runners across each week’s fixtures. These trainers know the track intimately — they know which draws suit which dogs, they know how their runners handle Monmore’s bends, and they trial their dogs on the track regularly. A runner from a trainer with a strong Monmore strike rate is a runner with preparation behind it. The racecard tells you who trains each dog. Cross-referencing that name against recent results — available from the GBGB database or specialist form sites — gives you a data point that the market sometimes undervalues.
Trainer form is not static. A kennel that sent out five winners from eight runners last month may cool off this month. Injuries, dog retirements, and the natural fluctuation of greyhound conditioning all affect short-term results. The value lies in longer-term patterns: which trainers consistently perform at Monmore, which trainers specialise in sprint distances versus middle-distance races, and which trainers bring dogs into peak condition for specific fixtures. As Mark Bird, then-CEO of the GBGB, observed in his farewell statement: “UK greyhound racing is certainly better placed to enter a second centenary of sporting endeavours in the next couple of years, but we can never be complacent in terms of maintaining our sport’s social licence within society.” That push toward professionalism has raised standards across the sport, and trainer quality is one of the areas where the improvement shows most clearly.
Weight data on the racecard is a subtle indicator. Greyhounds are weighed before each race, and the card shows the most recent weight alongside the trend from prior runs. A stable weight — fluctuating by no more than half a kilogram between races — suggests a dog in consistent condition. A sharp drop of a kilogram or more might indicate illness, reduced fitness, or a deliberate training adjustment. A noticeable gain could mean a dog that has been rested and returned heavier, or one that is carrying excess condition. Weight changes on their own are not predictive, but in combination with form trends, they add texture. A dog whose form is declining and whose weight is rising may be losing fitness. A dog that has been rested, returned lighter, and shows an improved trial time may be primed for a good run.
The comment line is the racecard’s narrative summary of each previous run. Written by the race official, it describes what happened in plain language: “led early, headed bend three” or “slow away, ran on late.” These comments explain the form figures. A fifth-place finish accompanied by “badly crowded first bend” tells a very different story from a fifth-place finish alongside “outpaced throughout.” The first dog was unlucky; the second was outclassed. When you are comparing runners on a Monmore racecard, the comment line is the field that resolves ambiguity — the one that turns raw numbers into a story you can act on.
From Racecard to Selection: A Step-by-Step Example
Theory is useful. Application is better. Let us walk through how reading a Monmore racecard translates into an actual selection, using a hypothetical but realistic 480-metre race.
You open the card for Race 6, a Grade A5 contest over 480 metres. Six runners. You start by scanning the form figures from right to left — most recent run first. Dog A in Trap 1 shows 1-2-1-1. Dog B in Trap 3 shows 3-4-2-3. Dog C in Trap 5 shows 1-1-1-2. On the surface, Dog A and Dog C look strongest. Dog B looks mediocre. But you are reading a Monmore racecard, not a lottery ticket, so you go deeper.
Dog A’s recent wins were at this track, at this distance, in Grade A6 — one grade below tonight’s race. It is stepping up in class. Its times were solid but not spectacular for A5 level, and its first-bend sectionals suggest moderate early pace. Drawn in Trap 1, it has the rail advantage, which at 480 metres is meaningful. Dog A is a contender, but the class rise introduces uncertainty.
Dog C’s three wins came at a different track — say, Nottingham — over a similar distance but from Trap 2 each time. Tonight it is drawn in Trap 5 at Monmore, a track it has not raced at before. Its times at Nottingham were fast, but track geometry differs between venues. A 480-metre time at Nottingham is not directly comparable to a 480-metre time at Monmore because the bends are shaped differently and the first-bend distance is different. Dog C has ability, but the wide draw and unfamiliar track introduce risk.
Dog B, the apparently mediocre runner, reveals more on closer inspection. Its form figures of 3-4-2-3 were all set at Monmore, at 480 metres, in Grade A4 — one grade above tonight’s race. It is dropping in class. Its comment lines read “crowded first bend” and “ran on strongly” — suggesting a dog that was unlucky in running and finished fast despite trouble. Its weight is stable and its trainer has a 22 percent strike rate at Monmore over the past three months. Tonight, drawn in Trap 3 — a neutral draw — in a lower grade than its recent form, Dog B suddenly looks like the value play.
This is what reading a Monmore racecard actually involves. The form figures are the starting point, not the conclusion. The trap draw adds context. The times and sectionals reveal running style. The grade reveals the level of competition. The trainer data adds a layer of insight. And the comment lines fill in the gaps. When you put all of these together for each runner, you end up with a picture of the race that is far more detailed than anything the odds alone can give you.
The final step is comparing your assessment to the price. If the market has Dog A as favourite at 2/1 based on its recent winning form, but you have assessed Dog B as the stronger selection after accounting for the class drop and track experience, and Dog B is available at 5/1, you have found a potential value bet. Favourites in UK greyhound racing win only 30 to 40 percent of the time, as analysis of the sport’s data consistently shows. The racecard is the tool that helps you identify the races where the non-favourite deserves a closer look.
Five Mistakes New Racecard Readers Make at Monmore
The first mistake is reading the form figures without checking the grade. A dog showing 1-1-1 in Grade A9 is not the same animal as a dog showing 1-1-1 in Grade A3. If the A9 winner is stepping up three grades tonight, those wins are almost irrelevant. Always check what level the form was set at before deciding how impressed to be.
The second mistake is ignoring the trap draw. New racecard readers focus on form and speed but forget that the starting position shapes the race. At Monmore, the inside draw carries a persistent advantage — especially at shorter distances. A fast dog drawn in Trap 6 might still need to work harder than a slightly slower dog drawn in Trap 1, and the racecard gives you the data to make that comparison.
The third mistake is treating times from different tracks as directly comparable. A 29.50 at Monmore over 480 metres is not the same as a 29.50 at Romford over a similar distance. Track geometry, surface, and running lines all differ. When comparing runners with form at multiple tracks, look at how their times ranked within their respective fields rather than at the raw numbers.
The fourth mistake is overlooking the comment line. It takes five seconds to read and it can change your entire view of a runner. A dog that finished last with a comment of “fell first bend” did not run a bad race — it had a bad incident. Ignoring the comment means you are treating that last-place finish as evidence of poor ability, which it is not.
The fifth mistake is backing the dog with the best recent form without considering price. The market sees the same racecard you do. If a dog’s form is obviously strong, its price will be short. The question is not “which dog has the best form” but “which dog offers the best value relative to its chance of winning.” A racecard gives you the information to answer the second question, but only if you read it thoroughly enough to disagree with the crowd when the numbers warrant it.